 N
AUSTRALIA
N
AUSTRALIAExtreme Weather Events
Rising temperatures caused by global warming do not evenly heat the planets air, surface and oceans due to many local factors.
The resulting temperature gradients are already becoming more extreme than in recent earth history (at least since humans have been walking this planet), causing more frequent and more severe local weather events. The more we allow CO2 emissions and global temperature to rise, the more extreme weather events we are going to experience. And there is a large lag-time. We are only experiencing the beginnings of more extreme weather. We are suffering now for the carbon our fathers and grand fathers released; our children will likely have to suffer much more extreme weather than us. We need to reduce greenhouse gases as fast as we can (see Solution section) or the consequences for our grandchildren are likely to be catastrophic.
Global Warming and Extreme Weather
The sceptics are correct in saying that climate change and extreme weather are nothing new.
The difference with the present climate change is that the latter is caused by humans burning fossil fuels (over 2000 scientists and 100 governments have agreed on this in the IPCC reports).
As a consequence one thing is fairly certain: any extreme weather experienced in the past (except maybe extreme cold) is likely to happen more often and also become even more extreme. This is already happening with more frequent and more severe storms all over the world.
Historic Extreme Weather Events
So let's have a look at what extreme weather events we have had in the past.
It is prudent to prepare for more of these in the future.
IN
AUSTRALIA
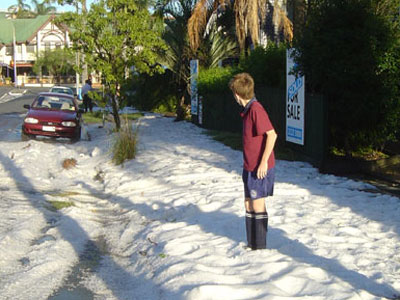
Biggest Hailstorms in Queensland
May 19, 2005 - A localised but intense thunderstorm produced large quantities of hail through the western and northern suburbs of Brisbane with hail as deep as 15cm's across roads in places. Heavy rain associated with the hail led to widespread flash flooding and inundation of some properties. Residents were given no official warning at the time and had little chance to take the necessary precautions. Friday, May 20, 2005
http://www.abc.net.au/reslib/200505/r47702_125293.jpg
January 10, 1976 - Hailstones up to cricket ball size (official) and unofficially up to 12cm across. There was even an extreme report of one hailstone weighing 3kg.
February 12, 1965 - Hail 8-10 foot (2.4-3m) deep on the ground after a hailstorm at Guleguba.
January 1936 - The largest hail ever seen at Boonah (to the date of the report). One stone was 27.5cm in circumference, several over 20cm. Nine stones weighed 1.75 pounds. Windows broken, hoods of cars pierced. Jennings Mountain "Covered by hail", three to four feet deep at the foot.
December 3, 1869 - A very severe hailstorm at Grantham with hail as large as cricket balls piercing galvanised iron roofs. 58 holes were made in an iron roof 50 by 18 feet in size and each hole or tear was 7.5cm in diameter.
January 1, 1869 - A very slow moving thunderstorm dumped huge quantities of hail, causing hail drifts of up to 3.5m deep. More than 200 cattle were killed and there was widespread crop damage.
A5_v1
Biggest Cyclones in Queensland
8 March, 1878. Cairns suffers huge damages. Ships Louise, Merchant, Kate Conley and Hector Miss were sunk with no survivors.
11 March, 1890. Tropical cyclone hits Brisbane. River floods - 360mm in 24 hours.
24 March, 1890. Cyclone hits Townsville. Ravenswood has 431mm rain in 24 hours.
17 February, 1893. Cyclone hits Bundaberg. Floods from Rockhampton to Grafton, NSW. Mary River bridge in Maryborough washed away with 120 houses. Cyclone induced tornado hits Sandgate.
5 March, 1899. CYCLONE MAHIMA. Crosses coast at Princess Charlotte Bay. 307 fatalities of Asian and Island origin. Over 100 Aborigines were swept out to sea. Over 150 ships were sunk. Storm surge at Barrow Point was 14.6 metres. On Flinders Island, porpoises were found 15.2 metres up on the cliffs.
28 January, 1906. Cairns devastated.
16 March, 1911. Port Douglas left with only 7 out of 57 houses standing. Mossman and Cairns also hit.
21 January, 1918. Mackay hit by cyclone with almost every building damaged. A storm surge of 7.6 metres saw almost 3 metre waves breaking in the town centre.
10 March, 1918. Of 3500 residents in Innisfail only 12 houses remained. Mission Beach to the Atherton Tableland suffered destruction. Almost 100 dead.
3 February, 1920. Cyclone crosses north of Cairns. Every house at Mt Molloy and Kuranda unroofed or destroyed. Widespread flooding and enormous cattle losses inland.
24 December, 1971. CYCLONE ALTHEA. $50 million damage (at 1971 value) caused to Townsville. 90% of houses damaged or destroyed on Magnetic Island. 3.66 metre storm surge recorded just north of the area. 3 deaths. Hundreds of homes damaged
11 February, 1972. CYCLONE DAISY. Hit Fraser Island. Over 200 homes damaged at Pialba and other areas. Severe flooding to the Gold Coast where a peak swell height was recorded at 8.3 metres.
24 January, 1974. CYCLONE WANDA. Over the coast near Maryborough, it then caused significant flooding in Brisbane where 6007 homes were flooded. 13 people drowned and others died from heart attacks. The cost was $200 million (at 1974 value).
1
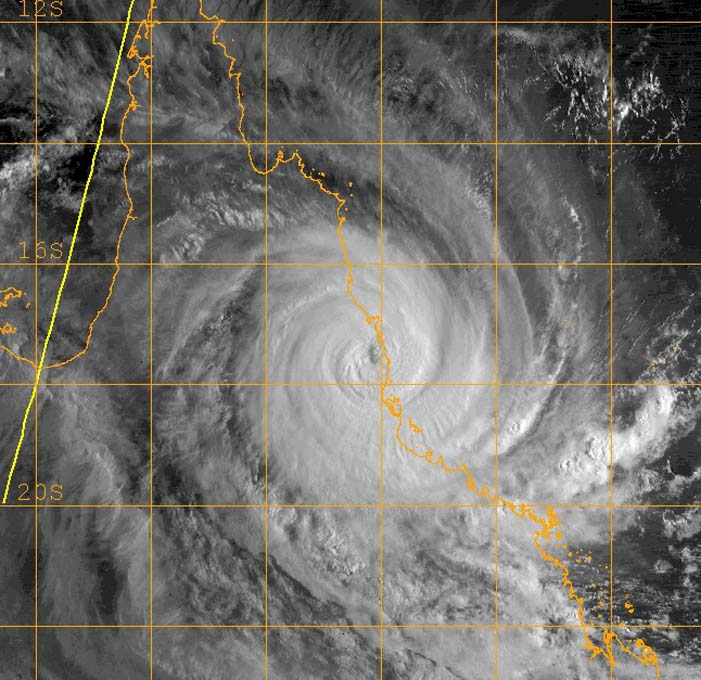
 February, 1986. CYCLONE WINIFRED. Crossed near Innisfail
with an eye diameter of 41km. A wind gust was calculated at 145
knots. Houses damaged. Cost was $130 million (at 1986 value). 3
deaths.
February, 1986. CYCLONE WINIFRED. Crossed near Innisfail
with an eye diameter of 41km. A wind gust was calculated at 145
knots. Houses damaged. Cost was $130 million (at 1986 value). 3
deaths.
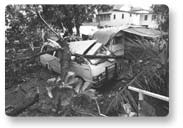
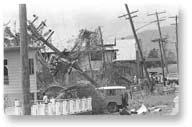
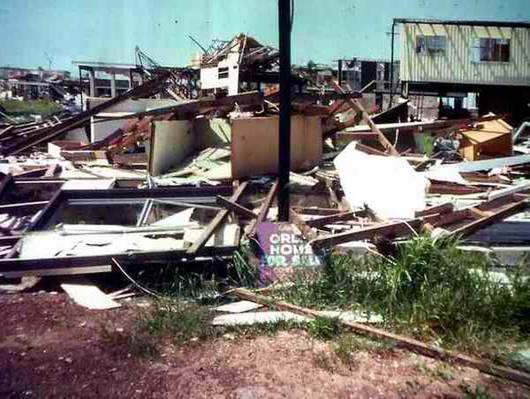
Just three examples of the powerful destruction properties of Cyclone Winifred
A5_v2
22-25 December, 1990. CYCLONE JOY. Travelled past Cairns to weaken in intensity crossing at Townsville. 97 knot wind gusts recorded. Structural damage south of Cairns. Induced tornado hit Mackay damaging buildings and causing floods. 6 lives lost. Cost $62 million (1990 value).
March 1997 Cyclone Justin caused significant damage in the Cairns region when it approached on two occasions in. Despite it being only a 'Category 2' cyclone, houses were undermined by huge waves, a marina and boats were severely damaged, roads and bridges suffered from flood and landslide damage and huge losses were inflicted on sugar cane, fruit and vegetable crops. The Queensland death toll was 7 and total estimated costs were $190 million (in 1997 values).
February, 2000 Cyclone Steve, with winds gusting up to 170 km/h (105 mph), tore off roofs and uprooted trees in and around Cairns.
2 - 5 February 2003. CYCLONE BENI caused floods from Rockhampton to the Gold Coast causing $10M worth of damage to public infrastructure. Waves were recorded to 8.5metres.
TROPICAL CYCLONE LARRY 2006
18th March 2006 Cyclone Larry crossed the coast as a category five storm with winds of up to 290 kilometers an hour (180 miles an hour). It hammered beaches with heavy surf, tore roofs off buildings and most destructively ripped out over 80% of banana crops. The Destruction cost around 300 million dollars and out of that 15 million dollars worth of damage was done to avocado crops, as the cyclone ripped across Queensland's orchards in the middle of the harvesting periods. Cyclone Larry is considered the worst cyclone Australia had experienced.
http://www.windworker.com.au/qldcyclones.htm
Gusts reached 240 km/h (150 mph)
The total effects of Larry were nearly A$1
billion 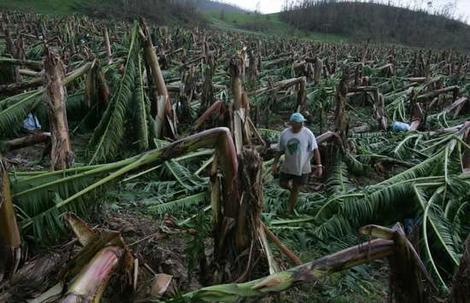 in
damage
in
damage
Biggest Rains and Floods
December 1897 The rainfall at Katherine, NT was 2961 points.
Cairns early 1900'ds – 2m in 4 days
1-2 Jan 1979 - Top of Bellenden Ker, 1140mm in 24 hours
20
February, 1954. Cyclone crosses at Coolangatta. 900 mm rainfall
recorded in 24 hours Widespread structural damage from Sunshine Coast
to Gold Coast. Boats left in treetops at Beachmere. Waves at Kirra
put 2 metres of water on the highway picking up cars. 900 mm rainfall
recorded in 24 hours. 26 people dead.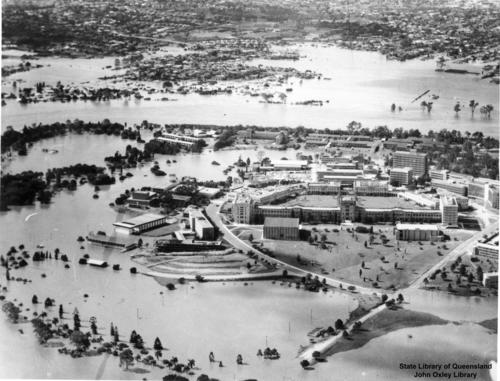
The 1974 Brisbane Flood produced the worst city flooding in Australian history. Moving ashore, Cyclone Wanda precipitated five days of heavy rain from 24 January, when rainfall levels of 1,318 mm were recorded and 819 mm in Brisbane itself. 300 people were injured and 16 people lost their lives. 56 homes were swept away and 1,600 homes were largely submerged. The total cost was estimated at $980 million
This image depicts the University of Queensland submerged by the banked-up river, with a view of Fairfield and Yeronga in the background. http://enc.slq.qld.gov.au/logicrouter/servlet/LogicRouter
B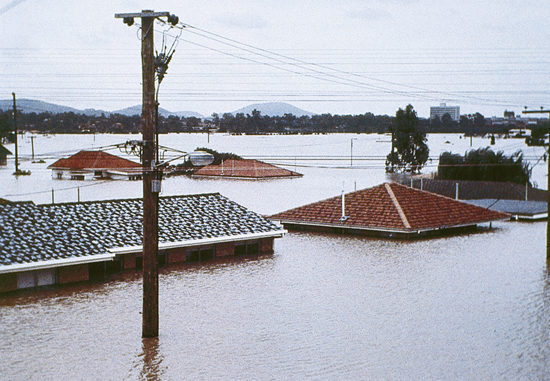 risbane
floods, January 1974
risbane
floods, January 1974
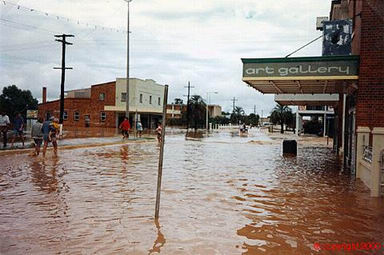
Charleville Qld 1990
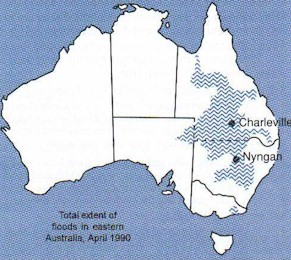
April/May, 1990 floods in eastern Australia were huge. They covered more than one million square kilometres of Queensland and New South Wales and a smaller area of Victoria (in a separate extreme flood). The map shows the extent of the floods - an area larger than Germany!
A5_v4
S torm
Surges
torm
Surges
11th February, 1999 To put the magnitude of the 1999 flood in perspective, consider that the Mary River peaked in Maryborough at 8.75 metres, a bit less than the 1992 flood which peaked at 9.2 metres. Several worse floods have been recorded, the worst being that of 1893, which reached a depth of 12.27 metres
http://dkd.net/maryboro/flood99.html
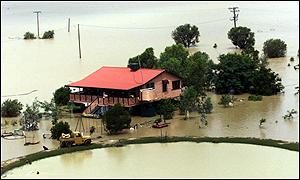
a homestead completely cut off by floodwater
Maryborough 1999
S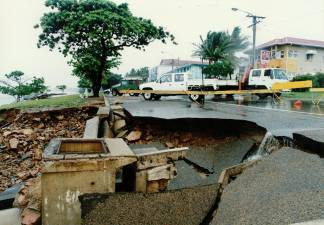 trongest
Storms
trongest
Storms
On 10 January 1998, torrential rain fell in Townsville causing wide-spread flooding throughout the city.
Townsville and Thuringowa experienced record breaking rain on and immediately following
10th January 1998. In 24 hours on 10th and 11th January, 549 mms fell at Townsville airport.
On the rest of the 11th and 12th through to the morning of 13th, a further 245 mms fell, giving a 3 day record of 794 mms.
At the same time as the heavy rain occurred there had also been gale force winds gusting all day, so that considerable quantities of vegetation added to blockages http://www.townsville.qld.gov.au/heritag
http://www.tesag.jcu.edu.au/CDS/Pages/reports/Flood1998TSVBis.pdf
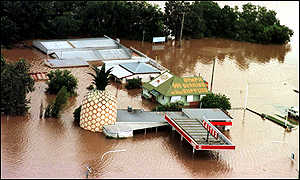
Gympie February 11,
1999
The Big Pineapple: A partly-submerged Gympie landmark
February 11, 1999![]()
Seven
people are believed to have died as a result of these devastating
flooding in the eastern Australian state of Queensland.
Floods reached a peak
of 21.95 metres
January 18, 1985 - Cricket ball sized hail driven by winds of up to 185km/h (offical measurement at the Brisbane airport) caused widespread damage throughout Brisbane. A storm which is to date Brisbane’s most damaging.
June 2007 – Newcastle, a 'super-cell' with severe winds and flooding led to 9 death, a coal tanker to beach itself, evacuation of thousands and economic loss
A5_v5
Fastest Wind
19 February, 1957. 109 knot wind gust recorded at Willis Island.
19 February 1975 The Australian wind record goes to Mardie in Western Australia, when winds gusted to 259 km/h (162 mph) during Cyclone "Trixie". Similar winds were probably recorded in Darwin (NT) during Cyclone Tracy in 1974, but we will never know exactly how strong they were because the instrument measuring wind speed broke down after recording a maximum gust of 217 km/h (136 mph).
20 July 2000 Wild wintery weather also lashed the Adelaide Hills with wind gusts and driving rain causing havoc in the region. The Bureau of Meteorology recorded wind gusts reaching 119km/h
23rd May 1997 WA – Busselton Wind speeds of 100km/h were recorded with reports of 150km/h in other parts of the region.
5th March 2002 Snowy Mountains, NSW: Severe Storm with wind speeds of well over 125 kmh and a massive 65 to 70 mm of water falling
15th July 1996 Perth Swan River, wind speeds of up to 200km/h
11th February 1999 FNQ Wonga Beach near Port Douglas recorded wind speeds of 160km/h at the mouth of the Mossman River a 1.4m storm surge was recorded
http://www.ema.gov.au/ema/emadisasters.nsf
W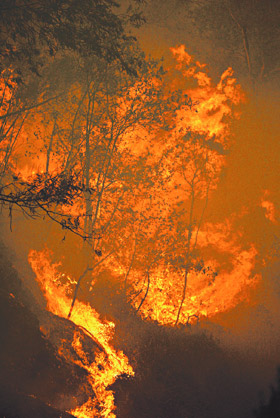 orst
Fires
orst
Fires
January 18, 2003, Canberra, Firefighters battled flames along a twenty-two-mile front. Modest ground fires became high-intensity blazes with temperatures exceeding 1,800 degrees Fahrenheit—hot enough to melt copper. Eyewitnesses described plasmalike balls of fire detaching from the fire front and blowing forward to ignite everything in their paths. Flames towered a hundred feet above the trees, and the wildfire grew so hot that it generated 150-mile-an-hour winds.
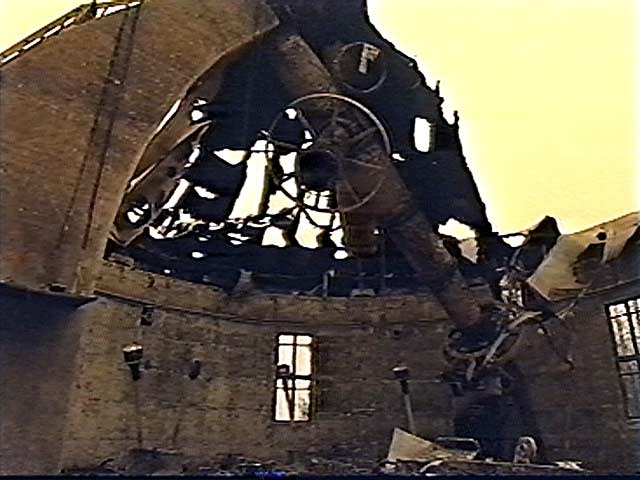
Ferocious bushfire swept across the western outskirts of Canberra, Australia, on January 18th, destroying the extensive observatory compound atop Mount Stromlo. At least six telescopes have been lost, including the 1.9-meter (74-inch) Grubb-Parsons reflector, the 1.3-meter (50-inch) Great Melbourne telescope, and the 0.7-meter (26-inch) Yale-Columbia refractor. Also destroyed were the 23-cm (9-inch) Oddie refractor, which was installed on the summit in 1910, and a laser-ranging station with its 1-meter telescope. The fire then consumed the main administration building, which housed the observatory’s library,
http://skyandtelescope.com/news/current/article_848_1.asp
A5_v6
PREDICTIONS
The latest modelling by the CSIRO shows that by 2030 Australia could warm by up to 2 degrees.
By 2070, the continent could be up to 6 degrees hotter.
For Melbourne, this means the average number of days over 35 degrees in summer could increase from 8 at present to up to 12 by 2030 and up to 20 by 2070.
For Perth such hot days could jump from 15 at present to 22 days by 2030 and 39 days by 2070.
Some parts of Australia are already hot with 45 and approaching 50 degrees Celsius.
Those sorts of conditions will become more common in future, and indeed, the worst case scenario is some parts could become uninhabitable.
In an already dry continent, there'll be even less rain - rainfall could drop by 10 per cent by 2030 and 35 per cent by 2070.
For Perth, it could be a catastrophic 60 per cent drop
More extreme wet weather events are also predicted.
Rain, when it comes, will tend to more torrential, prompting flooding and landslides and cyclones in the north will have wind speeds 20 per cent stronger.
We can expect more bushfires - they'll be very widespread.
New cyclones are threatening to form and they could be a lot further south than we've seen for a long time.
Storm warnings are current for a broad area of the continent and
finally - yes, the heatwaves are going to continue.
http://www.abc.net.au/lateline/content/2004/s1244258.htm
The CSIRO forecasts
within a few short decades, global warming will bring more heat waves
and fewer cold snaps across most of the continent, and areas of
inland Australia will face more than 100 days a year of 35 degree
plus temperatures with lower rainfall.
Wilcannia in regional New South Wales, already has 59 days a year above 35.
By 2030 the CSIRO says it'll face 83 such days
By 2070, 136 days.
Even Canberra, which has about five days a year now above 35, could
experience 13 days a year of extreme heat.
The report's
author, Kevin Hennessy, says for many places the number will more
than double
A CSIRO study warns if global warming continues, by 2070 the number of days above 35 degrees will soar, with many inland towns facing well over 100 days a year of extreme heat.
http://www.abc.net.au/worldtoday/content/2004/s1243771.htm CSIRO scientist Kevin Hennessy
A5_v7
WORLDWIDE 2007
Rainfall in China
June 11, 2007 - From Wednesday to Saturday, continuous torrential rains, mudslides and floods hit Hunan, Guangdong, Guangxi, Guizhou, Jiangxi and Fujian provinces and regions, affecting more than 8.97 million people.
 "Floods
caused by heavy rains have affected about 294,800 hectares of crops,
completely destroying 53,000 hectares of them," an official with
China's Ministry of Civil Affairs told Xinhua news agency.
"Floods
caused by heavy rains have affected about 294,800 hectares of crops,
completely destroying 53,000 hectares of them," an official with
China's Ministry of Civil Affairs told Xinhua news agency.
The floods have demolished 48,000 homes and damaged 94,000 others in southern China, killed at least 66 people, and forced about 591,000 people to evacuate their homes, the official said.
The ministry has estimated economic losses of more than 2.9 billion yuan ($448 million) to the region. http://www.abc.net.au/news/
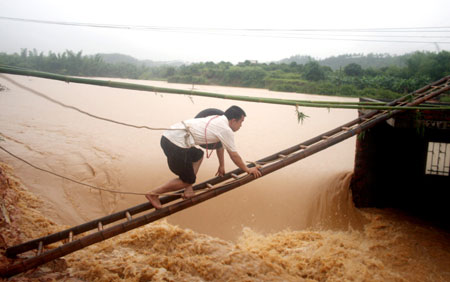
A man climbs a ladder to reach a drainage sluice station in Zi Jin County, South China's Guangdong Province June 10, 2007. It is the worst flood to threaten 15 towns of the county in 50 years. [Xinhua] http://www.chinadaily.com.cn/china/2007
Un-seasonal Flowering in the Netherlands
Observers in the Netherlands reported that more than 240 wild plant species were flowering in December, along with more than 200 cultivated species. According to biologist Arnold van Vliet of Wageningen University, this unseasonable flowering is being caused by extremely high autumn temperatures.
The mean autumn temperature in 2006 was 13.6°C, which is 3.4°C above the long-term average. It was even 1.6°C warmer than in 2005, which was previously the warmest autumn since 1706, when records were first kept. It is very likely that other European countries also experienced unseasonable flowering due to the high temperatures.
the effects of the extreme weather conditions in the Netherlands
during the second half of 2006. This year included not only the
warmest July and September on record, but also the wettest August.
Temperatures were far above normal: 3.7°C higher in September,
3.3°C higher in October and 3°C higher in November. The first
17 days of December were even more extreme, registering 4.2°C
above normal. For the entire autumn the average temperature was 3.4°C
above the long-term average and even 1.6°C warmer than the autumn
of 2005, which was previously the warmest on record in the
Netherlands.
An analysis of the observations revealed that
over 240 wild plant species were observed to be flowering during the
first 15 days of December. Examples of such species include Cow
parsley, Sweet violet and Evening star. According to scientists at
Wageningen University, only 2% of these plants normally flower in the
winter, while 27% end their main flowering period in autumn and 56%
before October. In addition, the observers reported that more than
200 garden plants were flowering in December.
http://www.physorg.com/news85834815.html
A5_v8